Getting Started with RevOps Part 5: Churn Analysis
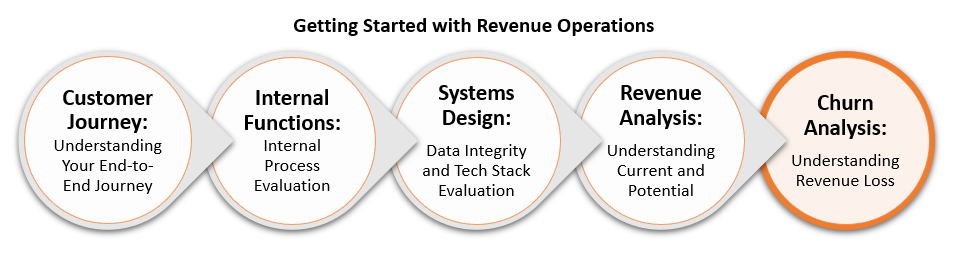
Churn Analysis, the fifth in our series highlighting how to get started with Revenue Operations.
Revenue Loss – Measure, Manage and Review
We started this blog post series with a focus on the customer journey, emphasizing your customer as the cornerstone for all business processes and operations. Unfortunately, the reality is that most companies must contend customer churn as part of the course of business.
We also discussed the importance of generating and examining your revenue to understand both from whom and how it was generated. The same is true for customer churn. Understanding churn (also more positively referred to as “retention”) is a crucial part of the SaaS recurring revenue model.
In this post, we will discuss the next step in the RevOps journey, which is to understand and evaluate churn so you can leverage these insights to improve the overall customer experience and take steps to retain revenue.
Measuring customer churn
There are two primary churn metrics to consider: revenue churn and customer churn. These are sometimes referred to as dollar churn or logo churn, respectively.
Revenue Churn: measures the amount of revenue paid by the customers leaving your platform.
Customer Churn: measures the number of customers leaving your platform.
It’s critical to track both types of churn. These two metrics are co-dependent and dynamic, so the measurement of each metric needs to be tied closely to the other. In addition, both should be measured as a percentage of the total number of customers and total customer revenue – this is called a churn rate.
Churn Rate: number of logos lost in a set period/customer base within the same period
Without balancing customer and revenue churn, as well as understanding its relationship to the total customer base, we will not get the full picture when it comes to churn. Take, for instance, a company that churns 10 customers in one week. Without knowing if these were high- or low-revenue customers, and, without setting that churn metric against the total customer base, it’s nearly impossible to measure the impact of those 10 lost customers.
Measuring churn monthly makes it easier to predict revenue. Using our churn rate, we can calculate the revenue we receive from a customer over the course of their life with the business, or lifetime value (LTV).
LTV = Average Monthly Recurring Revenue per User * (1/Monthly Churn Rate)
Higher churn rates generate a lower overall lifetime value of a customer because it reduces the likelihood of each customer staying with you for a long period of time. All these metrics should be tracked regularly, with increases and decreases in each thoroughly evaluated.
Along this same vein, dollar retention metrics have become a standard Key Performance Indicator (KPI) within a SaaS company’s business health and is measured on both a gross and net basis.
Gross Dollar Retention: the measurement of annual revenue retention, exclusive of upsells and downgrades
Net Dollar Retention: the measurement of annual revenue retention, inclusive of upsells and downgrades
According to the 2020 OpenView SaaS Metrics Survey, top-tier gross retention rates are consistent at 85%-90%, regardless of size or industry, where net dollar retention in high-performing companies is north of 100%.
Measuring these KPIs is an excellent start to understanding churn and revenue loss, but it’s equally important to act on this data. One important value driver from Revenue Operations is first tracking and managing these metrics, then using the data to improve processes to mitigate churn.
Managing customer churn
Unless you can begin to understand which customers are canceling when and for what reason(s), you cannot begin to enact change to drive lower churn rates. No one is better equipped to provide that information than the customers themselves. To begin capturing this information, you need to implement a standardized customer feedback process.
Start by simply asking for this information from each churning customer. Too often, companies shy away from requesting this information because they’re afraid of the answer or because the customer is upset.
A quick form survey or phone call from a customer service representative can ensure you have appropriate tracking information for each churn request.
Regardless of how customers cancel – form, phone, email, etc. – the process needs to be standardized to ensure you are capturing all necessary data, in the same way, for each customer. Doing so requires mandatory fields captured within your CRM. Fields we suggest you include are:
- Cancelation Date: the date which the customer actively cancels
- Age at Cancel: the time between purchase date and cancelation date
- Competitor: who the customer is going to
- Cancelation Reason(s): why (or the root cause for) the customer is leaving
The cancelation reason in this case should be the true cause for the customer leaving. The note, “Going to XX competitor,” for example, is not a cause for cancelation, but rather an outcome of them leaving.
Instead, this field (or fields) should reflect what drove the customer to that decision. Because reasoning is often complex, we recommend that whenever possible, encompass multiple fields that are hierarchical or have dependencies upon one other.
For example, if the customer states that the system was “too hard to use,” that can be your primary category, but the secondary category should ask a deeper question: why was it too hard to use? Did they not receive training? Does their business model require employees to be in the field and there isn’t an available mobile version? Getting to the “why” is crucial in categorizing churn reasons and optimizing data.
Keep in mind that this is only some of the information you should capture. This should be required information to acquire at the time of cancellation, but there are other data points that are important to our analysis that should already exist within the customer’s profile.
These metrics should be analyzed so we can determine if there are similar trends when customers cancel. These other attributes include but are not limited to:
- Industry or vertical
- User or company size
- Geography
- Average revenue
Now that you have your KPIs and a standardized tracking process for who, when and why your customers are leaving, you need to move to the next step, cross-departmental review.
Reviewing churn
We suggest creating a feedback loop where you discuss churn and the reasons for it, as well as any other common traits or attributes among the customers churning on a regular cadence with all departments. After all, churn is not solely the responsibility of your post-sale customer teams. Force department ownership of this metric and the subsequent actions on the entire business.
Ask questions about the data that each department can answer.
For example, are you seeing small customers in one industry continuously churning? If so, then marketing should evaluate their spend as it relates to that industry, sales should evaluate their sales and compensation structure around deals in that industry, product should consider product fit or needs in that industry, and support should review resources provided to customers within that industry.
What if customers are canceling because they continually state you do not offer a particular feature that you do indeed have? In this case, marketing needs to review their marketing efforts around that feature both to prospects and the existing customer base, sales should consider selling the need or business problem as it relates to that feature, product should promote that feature within the product or the feature itself as it relates to true customer need, and support should proactively discuss the business needs of that feature.
The point is, improving churn should be an orchestrated, cross-functional effort.
Conversations around churn should also drive areas of focus for the entire business. As with every other business decision, resources are finite and the choice to drive forward in one area may mean making sacrifices elsewhere.
In addition to the KPIs mentioned above, this is an area to employ further analysis to understand trends that may not be glaring from customer responses. Similar to revenue analysis, a cohort analysis – grouping users based on shared traits – is an effective way to analyze a large set of customer data to visualize trends. This segmentation can also extend beyond the attributes described above. For example, cohort analysis by signup month may reveal the trend that customers are canceling within the first three months of signup after which cancellations level out. This should then lead to an understanding of what is happening in the first three months post-close. Is this related to onboarding and implementation times? Is this a subset of customers that we are selling but realize our solution does not support their needs in onboarding?
Another common segmentation view should be whether or not the churn reasons are controllable or uncontrollable. Customers noting, they are “closing the business for personal reasons” are a good example of uncontrollable churn vs. Customers who note “the system was too hard to use”, or controllable churn. Ensure the team is focusing on churn areas that are controllable and make the most fiscal sense for the entire business. Churn should be measured, appropriately managed and reviewed consistently via a concerted effort from all departments.
For more on Getting Started with RevOps, be sure to check out our entire series at the following links:
The information herein is based on the author’s opinions and views and there can be no assurance other third-party analyses would reach the same conclusions as those provided herein. The information herein is not and may not be relied on in any manner as, legal, tax, business or investment advice.
Third-party images, logos, and references included herein are provided for illustrative purposes only. Inclusion of such images, logos, and references does not imply affiliation with or endorsement by such firms or businesses.
Certain information contained in this content piece has been obtained from published and non‐published sources prepared by other parties, which in certain cases have not been updated through the date hereof. While such information is believed to be reliable for the purposes of this content piece, neither Mainsail nor the author assume any responsibility for the accuracy or completeness of such information and such information has not been independently verified by either of them. The content piece will not be updated or otherwise revised to reflect information that subsequently becomes available, or circumstances existing or changes occurring after the date hereof, or for any other reason.
Certain information contained herein constitutes “forward-looking statements,” which can be identified by the use of terms such as “may,” “will,” “should,” “could,” “would,” “predicts,” “potential,” “continue,” “expects,” “anticipates,” “projects,” “future,” “targets,” “intends,” “plans,” “believes,” “estimates” (or the negatives thereof) or other variations thereon or comparable terminology. Forward looking statements are subject to a number of risks and uncertainties, which are beyond the control of Mainsail. Actual results, performance, prospects or opportunities could differ materially from those expressed in or implied by the forward-looking statements. Additional risks of which Mainsail is not currently aware also could cause actual results to differ. In light of these risks, uncertainties and assumptions, you should not place undue reliance on any forward-looking statements. The forward-looking events discussed in this content piece may not occur. Mainsail undertakes no obligation to update or revise any forward-looking statements, whether as a result of new information, future events or otherwise.
No representation, warranty or undertaking, express or implied, is given as to the accuracy or completeness of the information or opinions contained in the enclosed materials by Mainsail and no liability is accepted by such persons for the accuracy or completeness of any such information or opinions. For additional important disclosures, please click here.